Storm Water Compliance Series: Hardness and Metals Data
Sunday, October 11, 2015
Article #2: Hardness and Metals Data
This is the second article in a series discussing data and guidance about industrial storm water in Ohio.
As discussed in our first article, PSARA obtained all benchmark monitoring data through May 2015 for the current Ohio Environmental Protection Agency (EPA) Multi-Sector General Permit (MSGP). Several parameters, including most metals, are determined for each facility on a sliding scale dictated by the hardness of the receiving waters for storm water discharge. As hardness data can be obtained in three different ways, this introduces uncertainty into the process of evaluating which benchmark value applies. Permittees may use one of the following three approaches: conduct individual grab sampling; band together with other operators who discharge to the same receiving waters and conduct grab sampling once for the whole group; or use third-party data from a local water utility, previous stream surveys, total maximum daily loads (TMDLs), peer reviewed literature, other governmental publications, or data previously collected by the permittee, provided the data is less than 10 years old.
The range of hardness values reported in the data includes values so soft as to suggest water from a tap or captured rainfall, as well as values on the extreme opposite end of the spectrum. Of the approximately 1,500 hardness data points analyzed, 28 of the values were over 1,000 mg/L, and 38 reported values were at or below 10 mg/L. The wide range of values begs the question: how is hardness being established in the receiving waters of permit holders? If samples are being collected, are they being taken in the correct location—from the receiving waters—or from the storm water outfall itself?
The following map displays Median Hardness by Area (mg/L) throughout Ohio. While the data is from 1999, this is the most recent data available from the Ohio EPA and is still largely reliable because median hardness of surface water takes a relatively long time to shift. These ranges are much higher than many of the values reported in the electronic Discharge Monitoring Reports (eDMRs), and much lower in some cases.

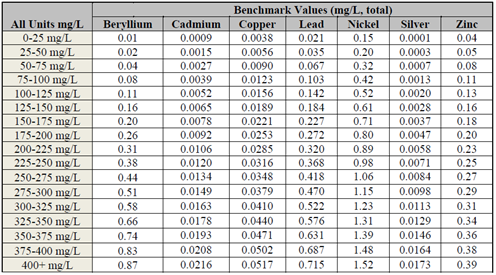
The benchmark values for beryllium, cadmium, copper, lead, nickel, silver and zinc vary based on the hardness of the receiving waters. The chart of these values from the MSGP is included below. As Appendix J of the MSGP points out, depending on the hardness values obtained during sampling or from records, benchmarks for certain metals can vary by more than an order of magnitude.
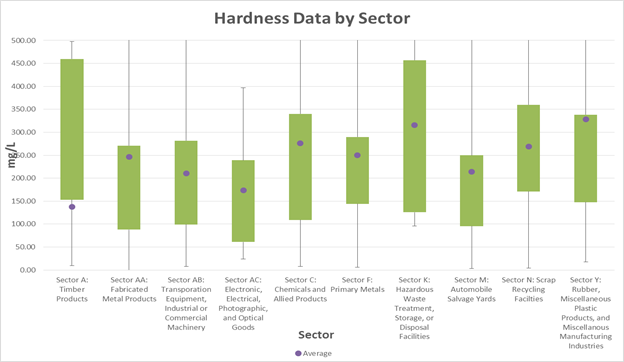
PSARA’s analysis of the hardness data included a minimum value of 0.11 mg/L in Sector AA: Fabricated Metal Products and a maximum value of 4,830 mg/L in Sector Y: Rubber & Miscellaneous Plastic. While all averages fall within a believable range of values, all but two sectors had outliers off the chart.
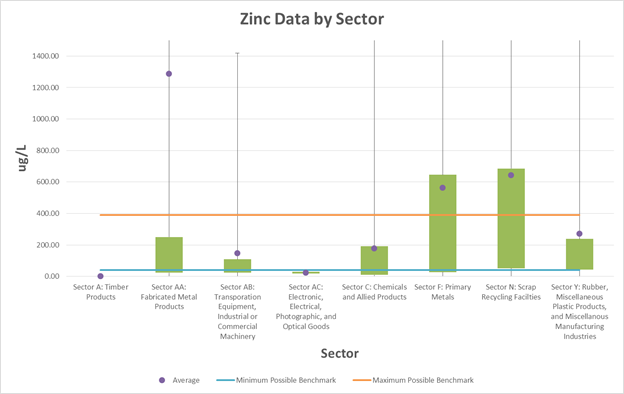
Turning to some of the parameter-specific data, it is important to note that the analysis by PSARA is meant to provide a 30,000-feet view of the data. Each of the following box-and-whisker plots have purple markers to indicate average values like the hardness data. In addition, an orange line represents the maximum possible benchmark according to the chart from the MSGP, and a blue line shows the minimum possible benchmark. An individual data point between the minimum and maximum lines may or may not be under the benchmark based on that facility’s hardness data; however, any values above the maximum are certainly not meeting benchmark requirements.